Request a Demo
Here are the Top 250 Women Leaders in Global Mobility for 2024!

Social Insights Inside

Social Insights collects, aggregates and presents your existing employees’ insights, testimonials, tips, data, and advice about lifestyle living and working in your office location. It is the fastest way for new joiners to get hyper-relevant info, from peers, and start settling in and connecting to your company community. 


How does it work?

Step 1

We create a survey to collect datapoints about life and work at your company, in your city, at your office.

Step 2

You review, then share the survey with your recently relocated employees and knowledgeable locals.  

Step 3

We gather the respondents' data, launch it on your Benivo platform and update it as employees move.


Preview


Overall relocation experience

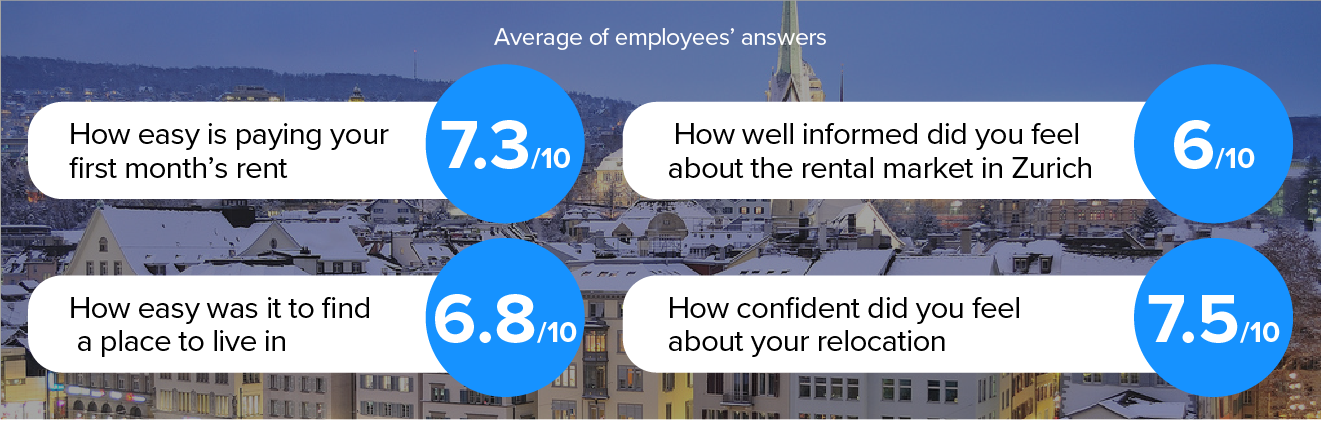
By asking employees to provide a rating of these 4 key areas, we can provide a benchmark score which provides an insight into any issues relocating employees may be facing.

Similar data collected includes: how easily employees obtained their social security, visa, bank account, and health coverage.

Relocating to Zurich.png


Main settling-in issues

In this infographic we identify the main issues employees face when settling in a new location, and show how many of the company’s employees struggled with these issues.  Although they may seem small, these troubles can be a barrier for new employees when they are trying to settle into their new surroundings with their new company.

SI Google-24(1).png


Budget vs rent

Using our internal database, we provide information about employees' financial expectations and the realities of relocating: How much employees thought they would pay in rent prior to moving, contrasted with the amount they ended up spending.

This data helps you manage young renters' expectations, especially when moving to cities with dynamic rental markets such as London, Dublin and Lille.

Budget vs Rent_Bloomberg London copy.png


Where to live infographics

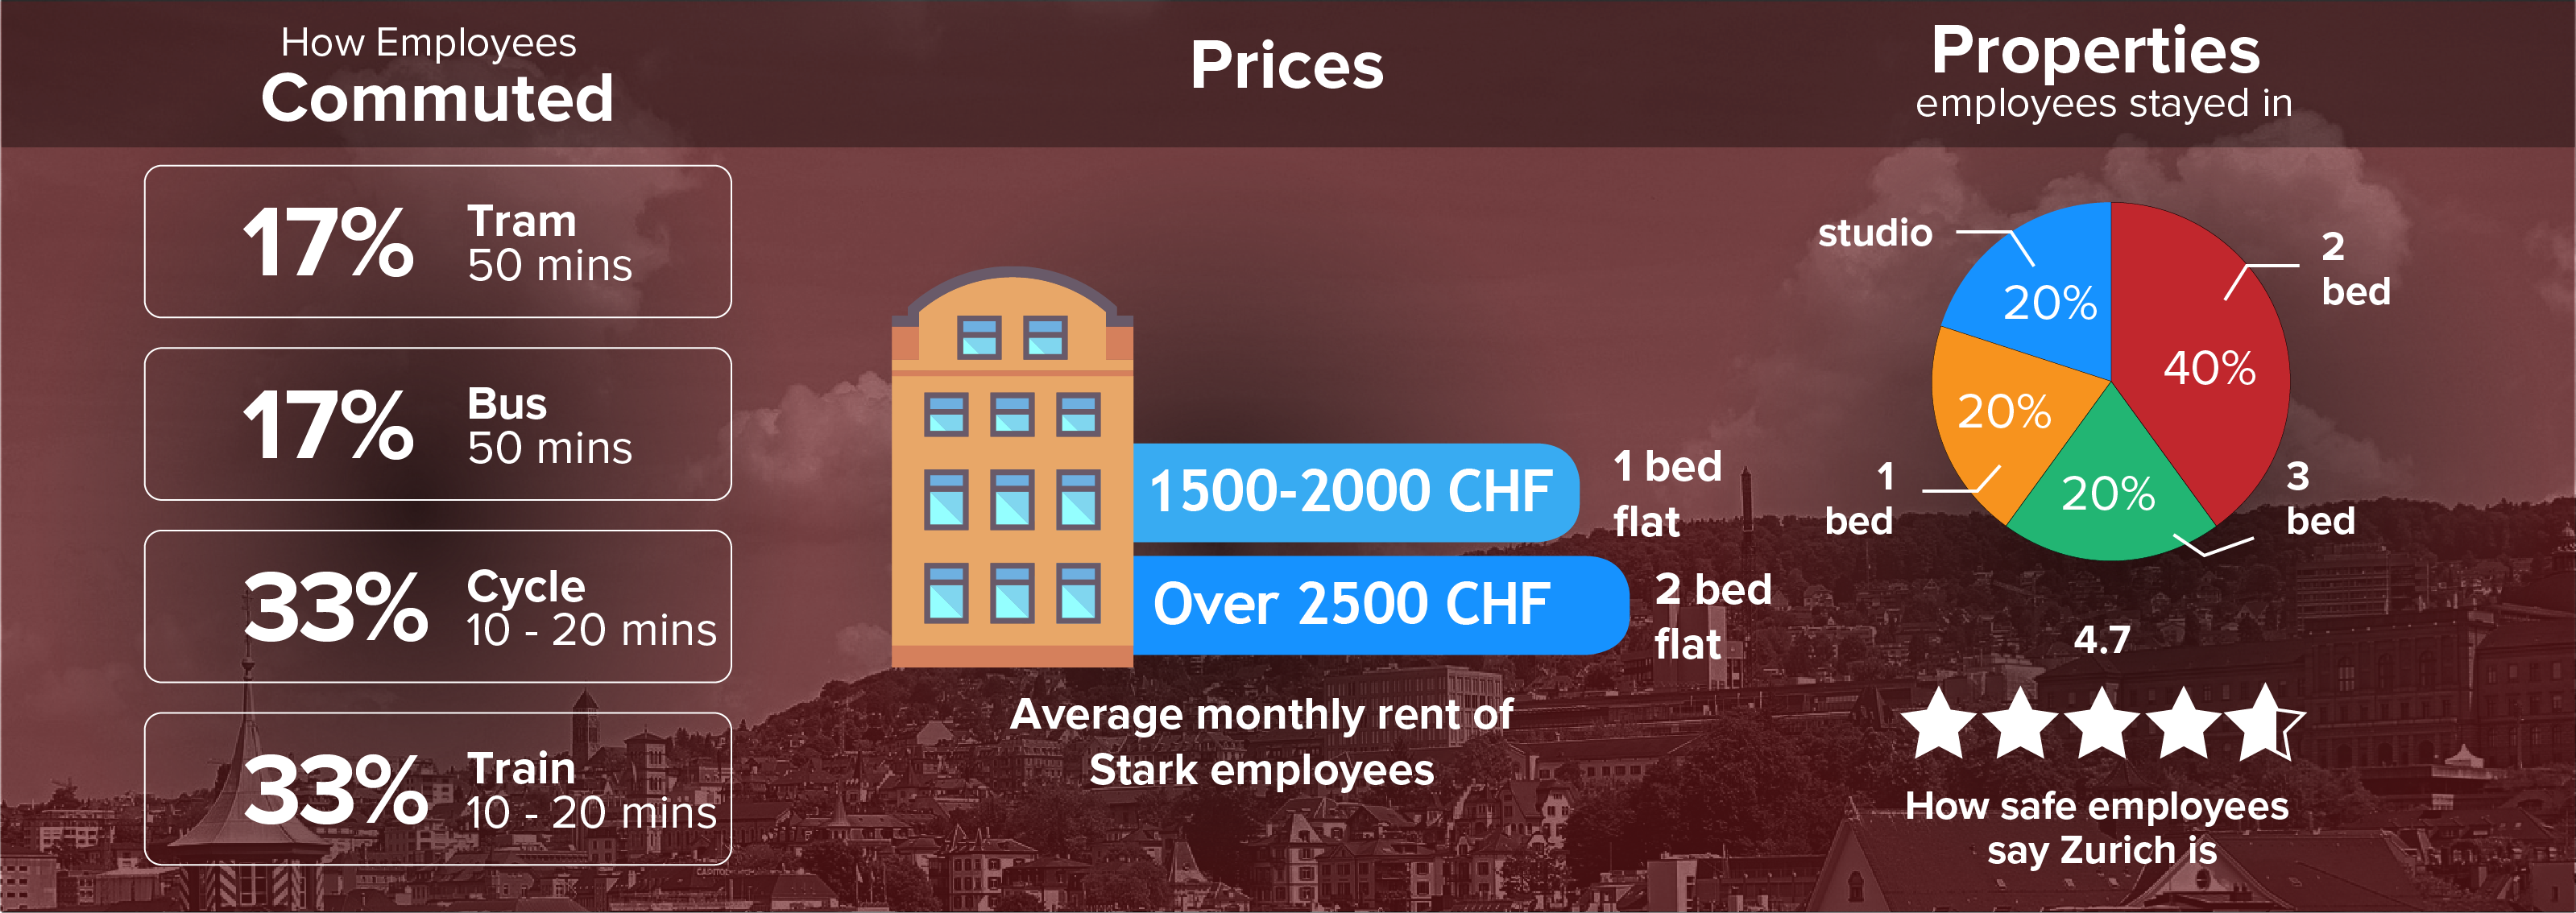
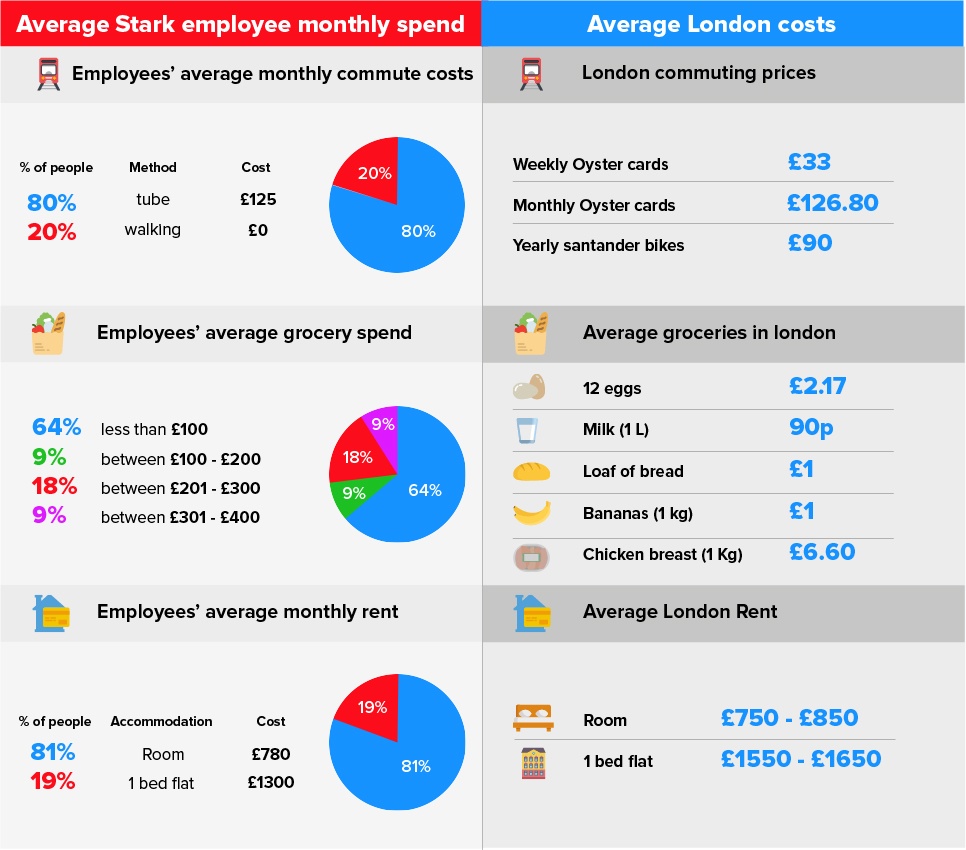
The two versions of these infographics depend on the size of the location and the distribution of employees living within it. They show how far employees commute, average rental prices and the most popular types of accommodation.

Stark Interns V2.jpg

 Where to live header-1.png


Location infographics

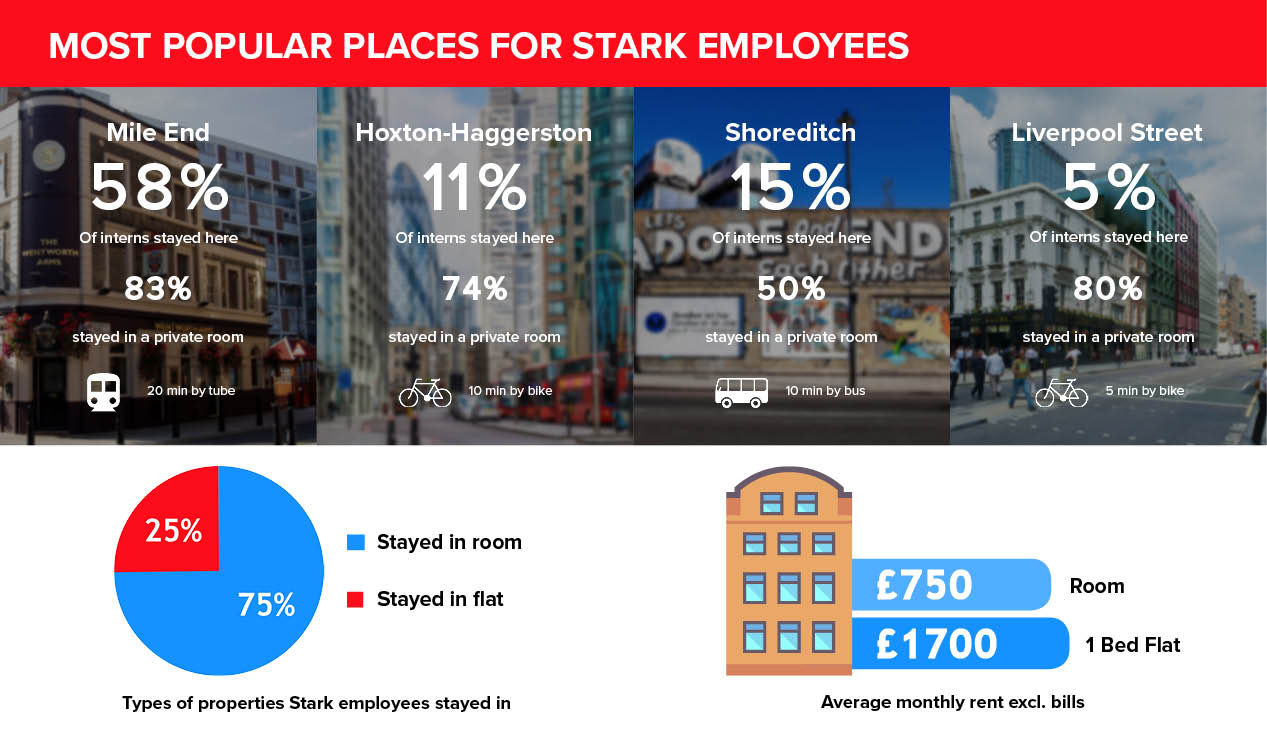
Furthermore, we can provide data on each individual area chosen by employees, giving insight into the best locations for affordable renting, commuting, and types of accommodation.

Stark  where to live.jpg


Cost of living

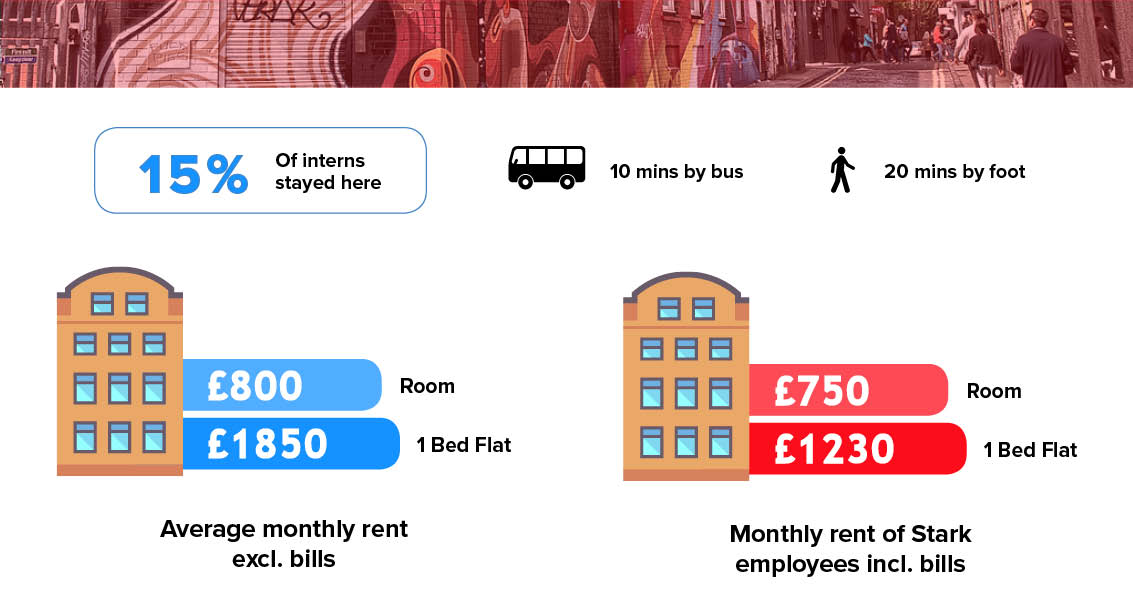
This data analyses previous employees’ living costs, focusing on the 3 main expenses; rent, groceries, and commuting. These figures are shown alongside average prices in the city, allowing employees to see how their current living costs compare with prices in the new city they’re moving to.

stark where to live.jpg


Satisfaction in [city]

This infographic answers an important question for Global Mobility teams and HR departments - will the best talent want to move here? Our report highlights how many employees were happy with their decision to move to the city to work with you, how many were not, and how many were not sure. We will also provide an overview of the most common reasons employees gave for their responses. This is great intel for your candidates and new hires, and will also alert you to any location-based issues you can address in order to attract top talent to your company.

why zurich.png


Product Features and Add ons